Finding the smallest separation of Venus and Jupiter
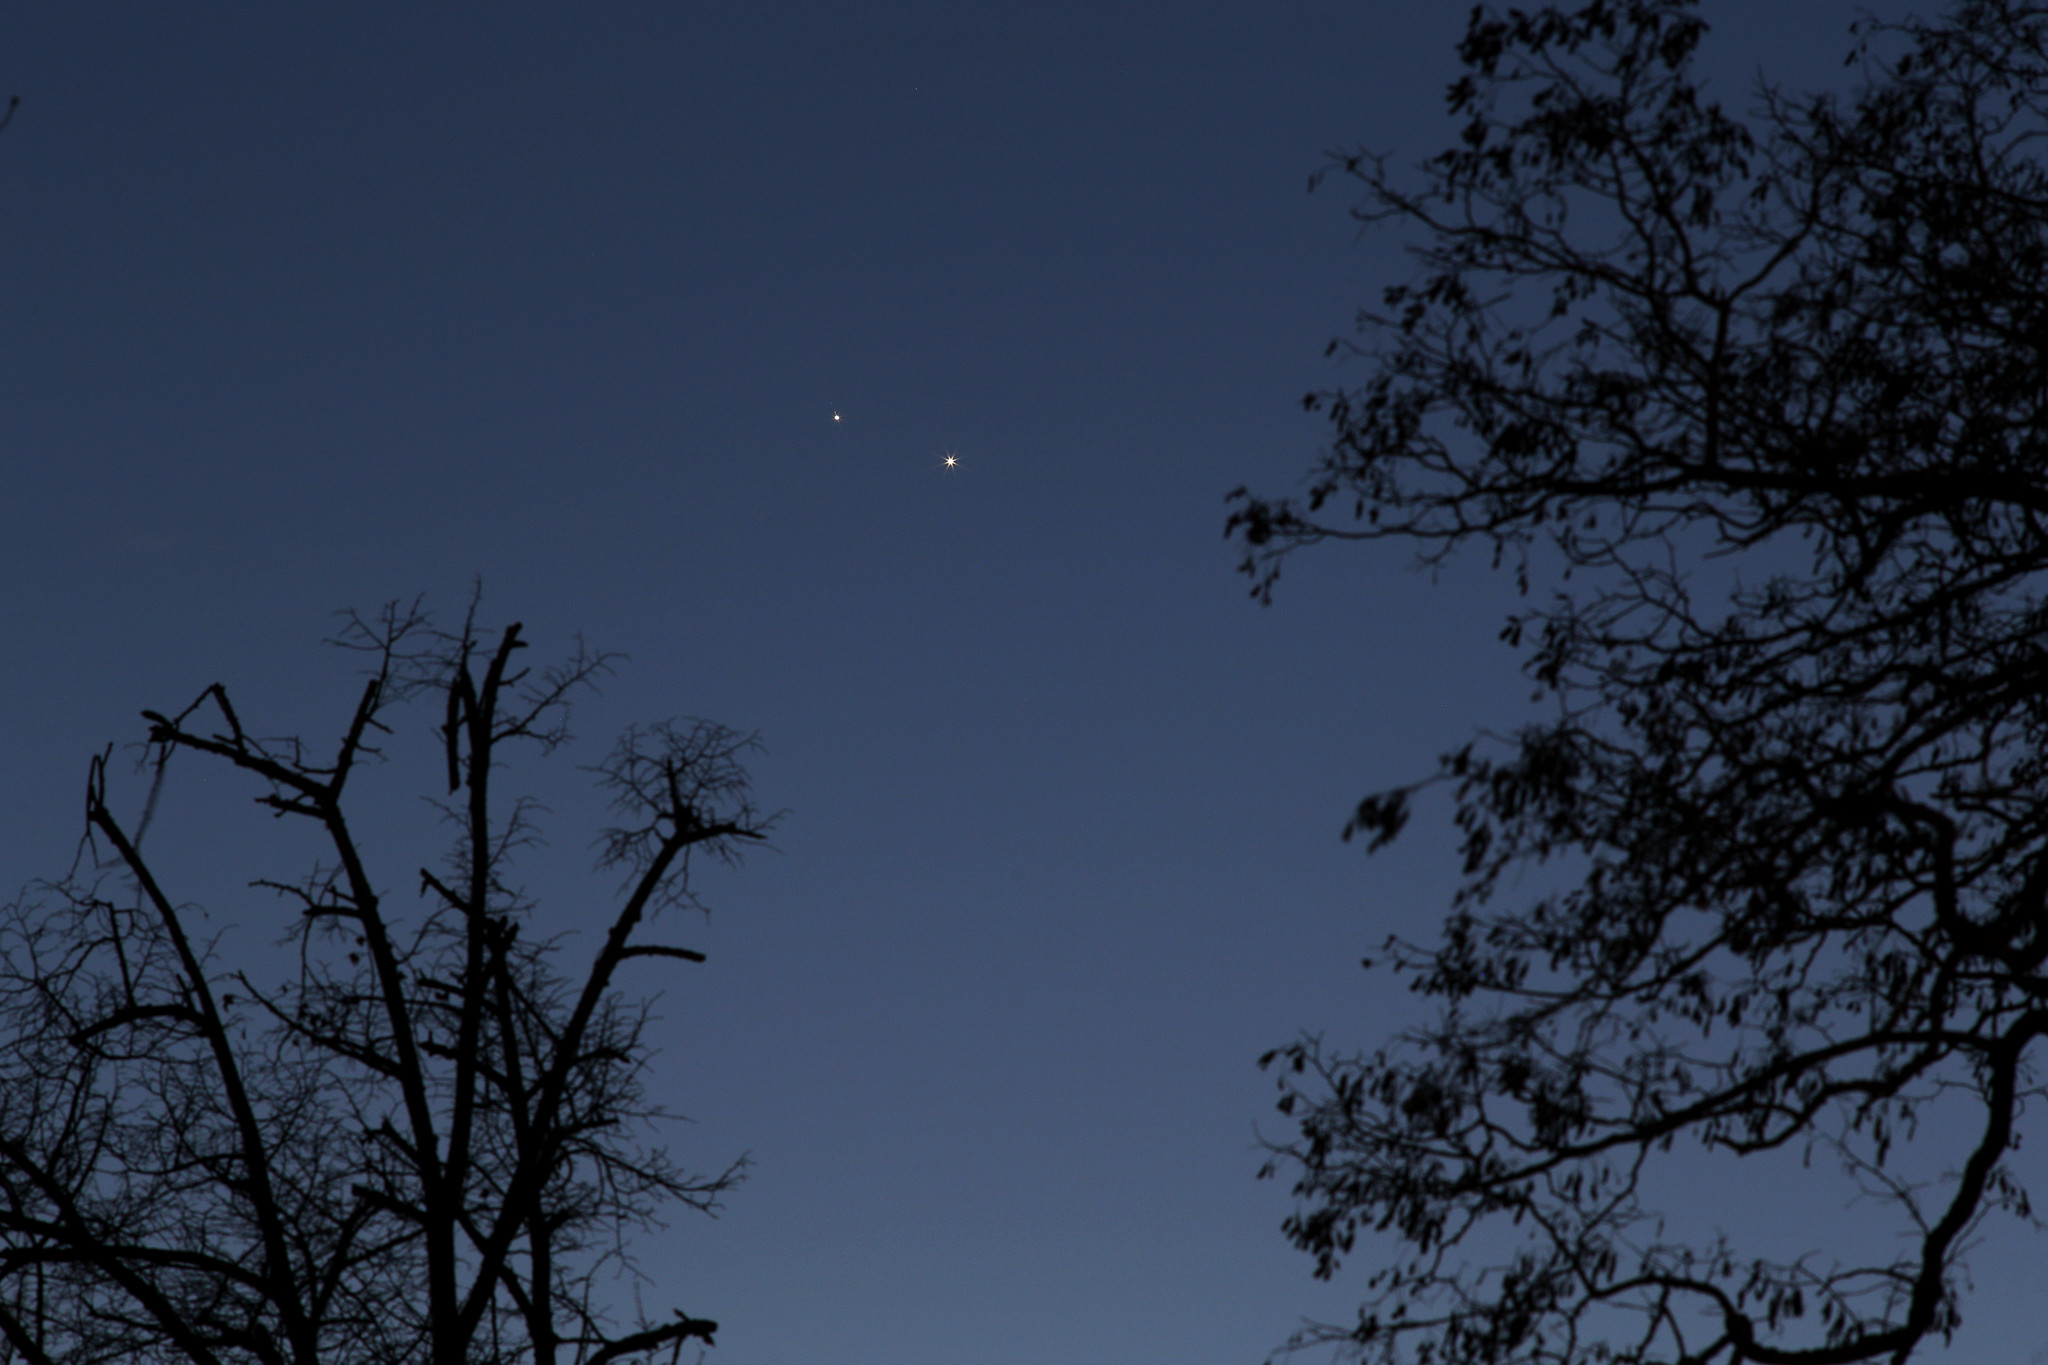
If you have looked up at the (cloud-free) sky around dawn or dusk these days, you may have noticed an unusual celestial sight: Venus and Jupiter in very close conjunction.
The reason I bring it up here is that a good friend of mine used it as a sort of astronomical ammunition to nerd-snipe me. He complained that all the popular science articles in mainstream news outlets just mentioned that Venus and Jupiter were going to get really close, but never said when exactly that would happen or how close exactly they would get. He then went on to say:
Imagine if it were possible for a layman like me to feed some GPS coordinates of my location, a unix timestamp, and two celestial bodies into a Python function and get out an on-sky distance in degrees!
…which I promptly took as an invitation to prove to him that this was, indeed, possible. A few minutes and less than ten lines of Python later, I showed him this:
# Import the right functions from astropy
from astropy.coordinates import EarthLocation, get_body
from astropy.time import Time

# Set up observation location and time (in UTC)
my_location = EarthLocation(lat=48.53, lon=9.06)
my_time = Time(val='2023-03-02 17:00:00')

# Compute sky positions of Venus and Jupiter
venus_location = get_body('venus', location=my_location, time=my_time)
jupiter_location = get_body('jupiter', location=my_location, time=my_time)

# Compute on-sky separation in degree
print(venus_location.separation(jupiter_location).deg)
>>> 0.6908709420973193
With just a little bit of extra work, we can evaluate the separation on a temporal grid and then use an interpolator to find the exact time of the minimum:
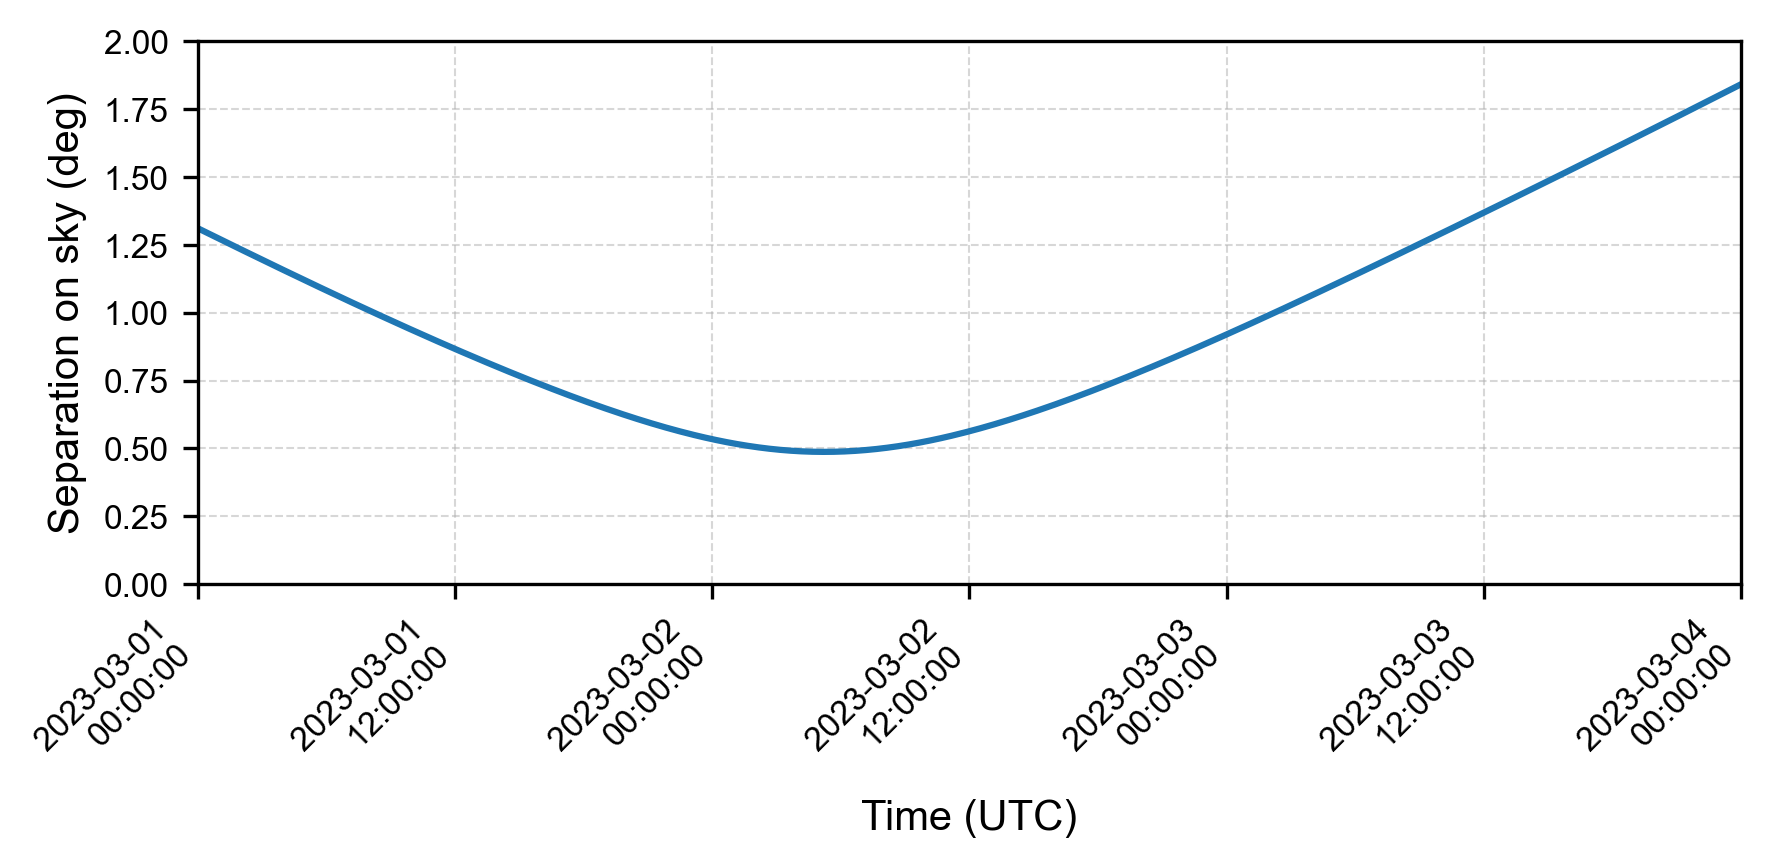
If we interpolate this with a fourth order spline and take the derivative, we get a cubic spline, which lets us compute its roots easily to find the minimum at:
Minimum on-sky separation (deg):    0.48744074356869627
Time of minimum separation (UTC):   2023-03-02 05:13:11.996774
These values were obtained for my (approximate) location; however, the exact position on Earth does not really make much of a difference as the parallax is only a small fraction of the separation anyway.
Lastly, I thought it might be fun to also plot the positions of the involved planets in the Solar System, to get a better understanding of what is happening, and why we are seeing what we are seeing. As it turns out, this is a bit more complicated than the few lines of Python above. Dealing with ephemerides does not seem to be part of the core astropy functionalities. The only library that I could find that was able to do what I wanted—calculate the positions of Earth, Venus and Jupiter in the Solar System at a given point in time so that I could plot them—was poliastro. Anyway, after a bit of tinkering around, I finally managed to put together the following animation:
Obviously, the planets are not to scale (because then you just could not see them), but their relative positions should be quite accurate. Unfortunately, the full code for this is a bit too long to fit into this blog post, but in case you are interested, here is the full Jupyter notebook that I used to create it.